One of the more fascinating parts of having a Data Analytics system and tracking metrics are the trends that we see both within an office and sometimes across many offices.  Our job, as we analyze these trends and data, is to try to determine WHY we are seeing a certain trend in the numbers we analyze.  Our experience in the office or in the industry in general, will lead us to make certain hypotheses about what we are seeing.

The next step is to either prove or disprove our theory.  To do that, we may need to track some activities manually.   While we always prefer to collect and use digital data, sometimes the answers we are seeking aren’t captured in the software.

For instance, we recently detected a declining capture rate in one of the office’s we work with.  The trend was specific to the associate and not the owner, who continued to see a steady or improving capture rate.  We speculated about what could cause this trend that had persisted over two quarters.  Were the dispensers not paying as much attention?  Were the patients seeing the associate different from the patients that see the owner? Were some of the solutions offered to the patients more effective than others?

When we spoke to the owner and associate, it wasn’t a trend they had been aware of prior to our conversation.  They began the same process of speculating about what could be causing it.  It certainly lead to a productive conversation about how the associate was finding it difficult to find someone to hand off to – a problem that the owner wasn’t experiencing.  Otherwise, they couldn’t pin point what the exact cause might be.

We decided to go through the exercise of tracking for a month to see what the root cause was.  We made a simple chart with the following headings:

  • Px Name
  • Glasses Solutions offered by Doc
  • Solutions purchased
  • Reasons for NOT purchasing
  • Who doc handed off to

We then tasked the associate with making sure the chart was filled out every day.  Part of the process was seeking out the Optical Manager to determine who purchased, who didn’t and why.

This exercise was productive for two reasons; one, it gave the associate an opportunity to connect on a regular basis with the optical manager.  It also lead to some insights into what resulted in a higher capture rate.

After tracking this information, we came up with two action items.

The first was to assign a dispenser to each doctor every day.  This way, there was no question when the associate came out who should be stepping up to catch the patient.

The second was the need to do an inventory analysis.  While the patients who were seeing the owner were finding frames that suited them, the associate’s patients seemed less likely to find their perfect pair.

We are now going to dig a little deeper and analyze what the objections and how we can close the gaps.

Tracking data can show us trends we may not even be aware of. While we may have hunches as to why the trend is occurring, it is a worthwhile exercise to put your hunches to the test. Not only will you have a better idea of how to close the gap but you don’t know what other benefits you may also discover.

KELLY HRYCUSKO

is the co-founder and managing partner of Simple Innovative Management Ideas (SIMI) Inc. and expert Practice Management contributor for Optik magazine. She can be reached at info@simiinc.com.


Share:
Rate:

0 / 5. 0

Any well-oiled machine works smoothly because all the moving parts work in synchrony with one another. So too does a  successful Optometry practice.

We are often asked what the best way is to motivate staff. Although there is merit to rewarding staff individually based on very focused goals and targets, one of the best ways to motivate for team effort is a group incentive based on total gross revenue.  The basic premise is that if everyone performs well at their assigned tasks, the team will meet their goals.

For simplicity’s sake, a practice can set monthly targets based on a percentage increase over the same month last year. A more strategic approach is to set targets based on revenue per “Doctor Day”.

Calculating Doctor Day Revenue
You can calculate revenue per “Doctor Day” by dividing the number of patients you see in a month by the number of days there is a doctor available for an entire day (7 hours) in a month.

Two doctors seeing patients in one day equals “2 doctor days”. For example, Dr. Opto generated an average of $80,000 each month and was in-office for an average of 20 doctor days each month.  Dr. Opto’s revenue per “Doctor Day” is $4000.  We recommend building in a 10% increase and then using this as your target. So in this example, the target revenue per “Doctor Day” for Dr. Opto would be $4400 per “Doctor Day”.

To get started, set up an excel spreadsheet with gross revenues targets for each doctor day in the office. The next step is to ensure that every member on your team understands how their efforts contribute to the attainment of the “Doctor Day” Revenue Goal.

Setting goals based on Doctor Days makes the incentive program fair, since we know that we need a doctor in the office. If the doctor takes two weeks off in July, then the targets should reflect this: some months like February are shorter with less Doctor Days, and March is a longer month with usually more Doctor Days. The targets need to match.

Fairness in the incentive program will enhance staff buy-in.

Link Behaviours to the Targets

Setting goals will only be effective if staff can see a direct link between their behaviours and the results.

Here are some tangible actions that can be established for each department:

Front desk staff

  • Understand and follow scheduling rules
  • Practice scripts to ensure they are ready to answer the more difficult objections and questions
  • Ask to book in family members that haven’t been seen in a while

Pre-testers

  • Anticipate who will need what testing
  • Check insurance coverage

Gallery staff

  • Make note of if and when the patient last purchased
  • Ask to give current glasses, including sunglasses, a “tune up”
  • Check insurance coverage

Lab Staff

  • Make sure jobs are ordered and received promptly.
  • Ensure jobs are delivered to patients in pristine condition

Doctors

  • Make notes on each patient on what tests and products you are anticipating the patient will need
  • Practice a solid hand-off to staff
  • Make solid, multiple-solutions recommendations from the exam room

Getting staff to contribute to this list and make suggestions to the above will further enhance buy-in to the program.

In the beginning, the owner of the practice should keep track of the results and share them with the team each day. This is a chance to rally the team spirit and encourage enthusiasm for the day ahead.   This is a great opportunity to reflect quickly on things that went well and things that did not go so well in the previous day. Once this routine is well established, many offices are able to successfully pass this role to their office manager.

It is key for staff to make the association between proactively engaging with patients to offer solutions rather than passively serving patients and improving the revenue per Doctor Day.

Lastly, when it comes to motivation, it is important to keep the reward and the positive result as close together as possible. We recommend either rewarding at the end of the month or quarter, but we wouldn’t recommend waiting longer than a quarter.

Sharing a percentage of the gross revenue at the end of the month is a great way to celebrate success!


KELLY HRYCUSKO

is the co-founder and managing partner of Simple Innovative Management Ideas (SIMI) Inc. and expert Practice Management contributor for Optik magazine. She can be reached at info@simiinc.com.


Share:
Rate:

0 / 5. 0

SYNOPSIS

High per-patient revenues are the core of practice profitability. Six steps get you there.

ACTION POINTS

CALCULATE PER-PATIENT REVENUE.Divide receipts by number of refractions.

PRESCRIBE FROM EXAM CHAIR. In your exam, recommend lens treatments and explain lifestyle benefits.

EDUCATE STAFF ON PRODUCTS. Have lens and contact lens vendors present to staff on how products provide solutions to patient visual challenges and eye comfort.

Our practice consistently achieves a high per-patient revenue (PPR) of $400 to $410 every year. Six steps keep our PPR high.

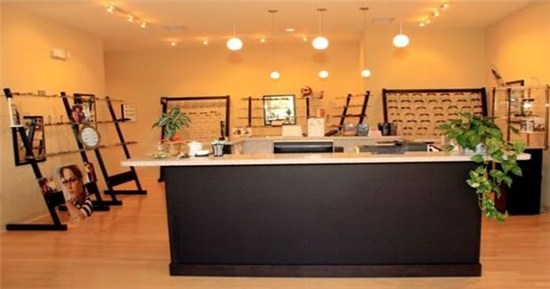
The optical dispensary in Dr. Click’s office makes eye wear very accessible to patients.
CALCULATE PPR

We use a very simple formula to track our PPR daily. Total receipts divided by number of refractions = PPR. I understand that this is a big picture number and that it does not separate out the medical visits or contact lens follow-ups from the routine eye exams.

DOCTOR PRESCRIBES FROM EXAM CHAIR

My staff of three and I practice chair-side doctor recommendations. I always recommend AR and Transitions to everyone. AR is standard on all lenses and is only not on lenses unless the patient specifically states they don’t want it and understand how they will be negatively impacted. When the lenses are presented to the patient we name all of the lens benefits without naming the brands.

We educate the patient how each benefit will directly impact their lifestyle issue or complaint. We also let them know the amount of savings they will have by using their vision benefits. If a patient decides they don’t want a specific item then we tell them what feature they are giving up. Most of the time patients decide not to downgrade their lenses once they understand what it means to their daily life. But sometimes they do and we try to make sure they truly understand everything, and aren’t making their decision based on misconceptions.

TALK PPR IN STAFF MEETINGS

We talk about the PPR at our weekly business meetings. I always believe the entire staff should know what all the goals are and how we are tracking because each staff member directly impacts the total patient visit. In our staff meetings, we teach the front desk to set the stage with a friendly, positive attitude. When the patient perceives that it is a warm, friendly and professional office, the patient is more likely to purchase glasses and/or contact lenses from us. I think the more knowledgeable each staff member is about their role, the more competent we are, and thus, the higher our perception of value.

PROVIDE NEEDED STAFF EDUCATION ON PRODUCTS

Everyone is encouraged and supported to obtain as much CE or courses as they can. The insurance specialist attends webinars and seminars about insurance updates. The optician and technician attend classes to keep their certification up to date. We also have vendors come in at least once a quarter to educate us. We recently had a Nike sunglasses seminar and we have a scheduled Transitions meeting in a few weeks. I have the entire team attend a portion of the meeting so that they know that we offer the product and know who to refer to within the team for more information if needed. My goal is to make sure that every team member knows what we are capable of doing for our patients even if they won’t be a part of the resolution.

HAVE VENDORS HELP STAFF PRESENT NEEDS-BASED SOLUTIONS

All the vendors are great in helping the practice improve PPR. Essilor is excellent at staff and doctor training for needs-based solutions. Needs-based solutions are where the entire team is recommending products that fit the patient’s needs. It involves everyone being more involved with the patient by asking detailed questions that lead to conversations about what people do for work, fun and hobbies. Every team member who works with a patient is encouraged to have three questions that they ask the patient to facilitate conversations.

Contact lens vendors are great in strategizing ways to increase annual supply sales, and our frame vendors help with frame board management so we can make sure we have fashionable and good quality frames. Our frames have a built-in two-year warranty, which increases the value of the frame because patients know they are covered if something unforeseen happens.

KNOW & ADDRESS COMMON CULPRITS BEHIND LOW PPR

I have found two main reasons for us having a lower PPR than expected some days. The first occurs when see a lot of patients who do not have a prescription need. We try very hard to educate all parents on the importance of children’s eye exams and we do see a lot of kids annually who don’t have a prescription need.

Fortunately, patients who have not had a prescription change still often purchase new eyewear because we reference our vision treatment plan from the previous year and base our recommendations on the part of the plan that wasn’t filled.

The second situation in which we see a lower PPR is when the practice is under-staffed. It is very important to have a well trained team as we have seen it negatively impact our bottom line.

RESOURCE ON INVENTORY MANAGEMENT

A detailed discussion of managing eyewear inventory is found in Key Metrics: Assessing Optometric Practice Performance, from the Management & Business Academy, sponsored by Essilor. For specifics on stocking inventory, see “Frames Inventory and Turnover” on page 28 and “Soft Lens Inventory by Practice Size” on page 37. –ROB editors

MAINTAIN ADEQUATE STOCK OF KEY INVENTORY

The effort to increase per-patient revenue starts in the exam room with the doctor and is then reinforced in the optical. But you have to have a good selection of merchandise inventory. It is disappointing when a patient is excited to buy and then decides not to when you don’t have the frame look they want.

Our goal is to have a 3x turnover per year per frame. So, a smaller practice like mine has about 400 frames in inventory as our goal of refractions is 1,200 this year. In contact lens inventory, we stock 100 one-day boxes: 50 from two individual vendors. In contact lens trials, due to space, we have trials of the lenses that we prescribe the most. If someone wants or needs a different brand, we order in the trials as needed. The trial sets are big and different sizes; we don’t have the room to have all the fit sets available, but we make sure that we can always give patients something at the date of their exam.

RACHAEL CLICK, OD

Rachael Click, OD, is the owner of Preferred EyeCare Center in Mount Pleasant, SC. To contact her: drclick@preferredeyecarecenter.com.


Share:
Rate:

0 / 5. 0

One of the most important management tasks in any eyecare practice is routinely tracking practice performance. Keeping a close eye on key metrics can reveal the successes, failures and opportunities. As CEO of your practice, you need to be on top of the financial health of your practice, and take corrective action to improve the areas of your business that may be falling behind compared to others. This is where key metric monitoring comes in.
VisionWeb produced an e-book, authored by Gary Gerber, OD, of the Power Practice;and Steve Sunder of VisionWeb, that includes eight key metrics deemed the most helpful in measuring the performance of independent optical practices. Their eBook, 8 Benchmarks ODs Need to Monitor in Their Practice, comes with a downloadable excel sheet that does all of the math for you! The eBook can be downloaded HERE.

METRIC 1: REVENUE PER PATIENT

Revenue per patient is calculated in a few different ways, depending on if you want to determine revenue per comprehensive exam patient, or revenue per all patients (including medical eyecare treatment patients). Let’s take a look at both formulas below:
The Formula: Gross Annual Revenue / # of Annual Exams Performed = Revenue/Patient
*MBA Example: $659,736 / 2,156** = $306
OR
The Formula: Gross Annual Revenue / # Total Patient Visits = Revenue/Patient
MBA Example: $659,736 / 2,598*** = $254

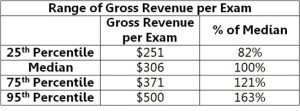
The national performance of ODs on this metric is very slowly increasing, through inflation and the gradual increase in dispensing of new technology products. On top of that, there is considerable variation in gross revenue per exam across practices. The most productive 10 percentof practices see revenue per exam nearly two thirds higher than the median (see table below).

*MBA example numbers are based off MBA norms. MBA has not directly measured gross revenue per medical eyecare visit, but available data suggests that the average revenue per medical eyecare visit is roughly comparable to that from an eye exam visit.
**Assumes 1.1 complete exams per hour for ODs working 1,960 hours annually (49 weeks at 40 hours per week).
***Assumes 2,156 complete exams and 442 medical eye care visits (17 percent of total visits).

Shown above in the chart are MBA (US data) norms: The median is $306, but the goal to aim for is the higher amount achieved by the75th percentile of all OD practices in the database. The highest percentile achieves an even higher revenue figure.

Improving Your Gross Revenue per Exam

If your practice is falling below the median, there are opportunities to increase revenue per exam with little or no cash outlay through office practice changes. Many variables can impact gross revenue per exam, but ODs should focus on the following to help increase revenue per exam:
• Average eyewear sale/dispensing ratios for premium lenses and frames
• Eyewear capture rate
• Professional fees
• Eyewear retail pricing
• Multiple eyewear purchase ratio

METRIC 2: REVENUE PER STAFF HOUR

Monitoring revenue per staff hour will help you evaluate the efficiency of patient management by your staff, and can signal if your office is over- or under-staffed. The median staff hours and revenue in this calculation can vary depending on the time period you want to measure. Here we look at annual hours and revenue, but you could also measure this on a monthly basis.
The Formula: Gross Revenue / Annual Median Staff Hours = Median Revenue/Staff Hour
MBA Example: $659,736 / 7,949**** = $83

****Equivalent to four full-time staff members.

Revenue per staff hour is weakly correlated with practice size, and the norm for this benchmark hasn’t changed in over seven years of measurement! Sixty percent of practices have a revenue per staff hour ratio between $70 – $100. If you’re getting a revenue per staff hour over $100 you should review your workflow and determine if staff additions would improve patient service. On the other hand, if your practice is suffering from a low performance on this benchmark, it could be from:

• Over-staffing
• Low revenue per complete exam
• Active patient base too small to support staff
• Staff hours to OD hours ratio of five or more – indicative of an inefficient patient service process

Related ROB Articles

Top Metric to Track: Eyewear Rxes per 100 Complete Exams

Top Metric to Track: Complete Exams per OD Hour

Top Metric to Track: Gross Revenue per Complete Exam

THOMAS F. STEINER

Thomas F. Steiner, Director of Market Research for ROB, has spent more than 25 years helping eyecare practices succeed, including pioneering the introduction of color contact lenses into optometry. To contact him: tnlsteiner@comcast.net


Share:
Rate:

0 / 5. 0

This final article of our three-part series on important benchmarks ODs need to monitor, looks at chair cost and expense ratios. All six benchmarks discussed in this series were pulled from a VisionWeb discussion of eight metrics optometric consultants Gary Gerber, OD, and Steve Sunder, of VisionWeb, deemed as important metrics to be tracked on a regular basis.

When we break down these benchmarks, we look at data drawn from the Management & Business Academy (MBA),a research program sponsored by Essilor. Over seven years, MBA gathered performance data from more than 1,800 optometric practices across the US. It has published the most comprehensive compilation of benchmarks currently available. You can visit mba-ce.com to access the MBA metrics research.

In total, the benchmarks covered in this series have included:
• Gross Revenue per Patient
• Gross Revenue per Staff Hour
• Optical Capture Rate
• Inventory Turnover Ratio
• Chair Cost
• Expense Ratios
If you want to monitor these benchmarks, plus two bonus benchmarks, in your own practice, you can download VisionWeb’s e-book HERE.

Chair cost is an important metric for independent ODs, providing one basis to establish professional fees and make judgments about which managed care plans to accept. There are a couple different ways to look at chair cost. You can determine chair cost from the total number of annual visits, or total number of annual exams.
Formula 1: Fixed Costs / Complete Annual Exams = Chair Cost per Exam
MBA Example: $260,876* / 2,156 = $121 per Exam
Formula 2: Fixed Costs / Complete Annual Patient Visits = Chair Cost per Visit
MBA Example: $260,876 / 2,598 = $100 per Patient Visit

The first thing you need to do in order to determine your chair cost is to calculate your fixed costs. You can calculate your fixed costs by subtracting your operating expenses, your doctor payroll, and your net, from your gross income. From there, you will divide your fixed costs by the number of complete annual exams, or annual patient visits, to get your chair cost.

MBA norms calculate a chair cost of $100 per patient visit. The most important thing here is making sure that your chair cost is lower than your insurance reimbursement.
*Fixed costs were determined by this formula: Gross revenue minus OD compensation minus Net minus COG.
MBA norms calculate a chair cost of $100 per patient visit. The most important thing here is making sure that your chair cost is lower than your insurance reimbursement.

METRIC #2: EXPENSE RATIOS

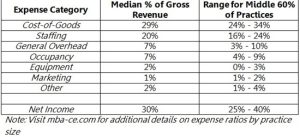
Monitoring expense ratios helps ECPs develop annual budgets and evaluate opportunities to raise net income by reducing expenses. The MBA has published expense ratios for the major expense categories that all independent ODs face.
The Formula: (Expense / Revenue) x 100 percent = Expense Rate to Revenue
MBA Example: (Cost-of-Goods): ($191,323 / $659,736) x $100 = 29% of Revenue

Typical expense ratios vary by practice size. In general, larger practices have somewhat lower ratios for cost-of-goods, occupancy, and general overhead expenses, but somewhat higher staffing ratios. The result is that larger practices, on average, enjoy net income ratios 10-15 percent above the median for all practices.

THOMAS F. STEINER

Thomas F. Steiner, Director of Market Research for ROB, has spent more than 25 years helping eyecare practices succeed, including pioneering the introduction of color contact lenses into optometry. To contact him: tnlsteiner@comcast.net


Share:
Rate:

0 / 5. 0

One of my favorite expressions is “measure twice and cut once!” These words of wisdom have been a mainstay of the construction industry for years. If you double-check your measurements, it is less likely that errors will occur and the business will be more profitable.
This business philosophy can also apply to an optometry practice. It is important to measure the financial key metrics of a practice in order to maximize the NET income and ensure an efficiently run business.
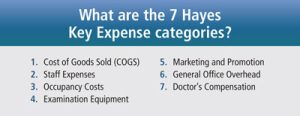
Here are the Hayes Center for Practice Excellence’s 7 Key Financial Metrics and how my practice has benefited from measuring and monitoring these financial benchmarks.
How do you measure the 7 Key Metrics?
The use of a computer financial software program has made the reporting of financial metrics much easier. We use QuickBooks by Intuit for all of our bill paying and deposits. At the end of each reporting period, my business manager generates a profit and loss statement with “percentages of gross income” selected in the reporting criteria section. Some initial work is required to set up the categories in QuickBooks based on deposits and payments to vendors and suppliers during the reporting period.

IDENTIFY KEY METRICS


ET SPENDING GOALS

Cost of Goods Sold COGS (26 percent-32 percent) – The Cost of Goods sold category is always the highest single expense in a traditional optometry practice. The following items should always be included in your Cost of Goods:
• Lab bills, blanks, uncut lens blanks
• Frames and cases
• Fair allocation for lab floor space
• Lab equipment, edger, surfacing equipment, dye unit
• Pro rata share of optician’s salary (excluding labor as a COGS is a common mistake)
Staff Expenses (18 percent-24 percent) – The second largest expense for traditional practices is what it costs to employ and support your staff. Staff expenses does not include the salaries paid to employed ODs; that goes under Doctors’ Net Income. Staff expenses also does not include wages for lab employees who cut, edge or surface lenses. Those wages go under the Cost of Goods category. Staff Expenses includes the following:
• Salaries
• Payroll taxes
• Uniforms
• Insurance
• Continuing education and other training
Occupancy Costs (5 percent-8 percent) – If you own your building, treat yourself as the landlord and your practice as the tenant who rents from you. Be sure the practice pays you fair market rent even if the building is paid off. Otherwise, you will be personally subsidizing the overhead of your practice in our profitability model.
While rent and interest are tax deductible, principal payments are not. The total you are spending to occupy your office is what counts, not how much you write off. The following are all considered occupancy costs:
• Rent
• Property taxes
• Utilities
• Maintenance
• Janitorial
• Insurance (property)
Examination Equipment (3 percent-5 percent) – Your examination equipment includes not only the equipment, but also the expenses associated with the equipment such as:
• Leases
• Interest on Loans
• Depreciation
• Service Contracts
• Maintenance
Marketing and Promotion (1 percent-2 percent) – Marketing expenses are highly discretionary. Interestingly, low-netting practices tend to spend more on marketing than high-netting practices. However, this does not mean that low-budget advertising is the way to go. The effectiveness of low-budget advertising is questionable. Things you should include in marketing and promotion are:
• TV, radio, and newspaper advertising
• Direct mail advertising
• Yellow Pages listings (However, this cost is often lumped in with the phone bill.)
• Web site
• Recall Services
• Web Review Site fees (Yelp, etc.)
General Office Overhead (6 percent-9 percent) – This category will include all other expenses you have for running your practice. It should include things such as the following:
• Front office equipment
• Phone
• Postage
• Legal fees
• Accounting fees
• Dues
• Subscriptions
• Insurance
• Office Supplies
Doctor’s Compensation (30 percent+) – The last item on the Hayes Seven Key Expenses is doctor’s compensation. Hopefully, this will be your largest percent of gross. This compensation would include:
• Salaries for the owner and any employed ODs
• Heath Insurance and Other Benefits
• Corporate Profits
• Pension and Profit Sharing
• Personal automobiles
• Cell Phone

SET PERFORMANCE GOALS

What made you change the way you look at your practice finances?
One of my job responsibilities at Southern College of Optometry is Director of the Hayes Center for Practice Excellence. I teach current and future optometrists the business side of practice. This provided me with the opportunity to enter into a Master of Business Administration program at a local university. My practice was struggling with its profitability and I was also looking for answers. The completion of the MBA degree taught me how to better manage the business side of my own practice. I can now share this knowledge and my experiences with students and fellow practitioners.
What are some of the variables that can affect the key metric percentages?
The first variable to look at is your fee structure. If fees currently charged for professional services, as well as materials, are too low, then the resultant key metric percentages will be significantly affected. This may signal the need to raise fees to compensate for increasing costs and expenses. Our practice had gotten complacent over a 3-4 year period and did not raise fees. This resulted in a steady decline in our NET income. We initiated a review of our current fee schedule and raised our professional service fees over a two-year period. Ophthalmic material fees were also adjusted where needed.
The other variable to examine is expenses. As mentioned in the breakdown of the Hayes 7 Key expenses, Costs of Goods sold and staff expenses are the two biggest expense categories. I personally feel that a staff that is efficient and productive should be well compensated, so I don’t have a problem with staff expenses being on the high side of the 18-24 percent range. Our staff expenses are 24 percent and they are very dedicated and hard working! Assuming the practitioner is doing a good job managing their operating expenses such as occupancy costs and equipment expenses, COGS is the category that deserves the most attention and can have the greatest impact on your bottom line.
What about Managed Care?
There is no doubt the increase in the number of managed care vision plans has affected the profitability of many optometry practices. Lower reimbursements can translate into lower collected gross receipts and lower NET income for the doctor. There are ways to battle this giant! Increased use of staff delegation and improvement in patient flow through the office can result in improved efficiency, and thus, more patients can be seen during the work day. But other changes may be needed to maximize the practice NET income. Better optical material purchasing decisions along with policies controlling other office expenses need to be in place. We scrutinize all purchases in the office and compare prices before a decision is made. We also use a manageable amount of good debt when purchasing major equipment and make lease hold improvements. By measuring the key financial expenses regularly and running your practice like a business, managed care can be beneficial to many optometry practices.

How did measuring your practice improve the bottom line?
After setting up our QuickBooks accounts and measuring the expense categories, we found our COGs percentages were significantly out of line with the Hayes Key Metric suggested goals. We made a change in our office manager and frame buyer and empowered a new trusted employee to correct the COGS problem. By doing this, our office reduced the COGS percentage in a short period of time. Our new office manager/buyer was given a budget and began the task of reorganizing the frame inventory and examining the ophthalmic lens and contact lens expenses. She eliminated some of the frame companies that had poor customer policies and this allowed us to increase our bargaining buying power. Our new office manager also attended education courses on frame board management and merchandising. Negotiations with ophthalmic lens suppliers also helped with margins. Contact lens purchases were more closely monitored and product returns expedited in a timely manner. In other words, the entire practice mentality changed and resulted in a significant increase in the net income.
How was your new office manger compensated?
Part of the new office managers/buyers salary compensation package was a merit-based bonus based on the improvement in the NET income. As a result she received a sizeable bonus, but more importantly, the doctor’s NET income was significantly improved.
Improve YOUR Practice’ s Profitability
I would make a couple of suggestions to my colleagues. Enroll in a business course at a local college or university. This additional course may provide a fresh new way to look at the financial health of your practice.
Another helpful change I made in my practice was joining an optometry peer group. It allows for the sharing of practice ideas and additional practice management education. I would strongly recommend a practitioner join one of these groups.
But the most important suggestion I can make is measure and measure again! Take the time to set up a financial software program and begin to measure the Hayes 7 Key Financial Metrics. You may discover an expense category that needs addressing or maybe that fees need to be increased. You won’t know this unless you take the time to measure the metrics and evaluate them!
If you measure these key metrics, you may be surprised to find out how successful or problematic your practice may be. Even if your efforts increase the practice NET income by 1 percent, the profitability of an average $600,000 practice will increase by $6,000….and no one would be upset about that!

Related Review of Optometry Articles

Advice for New and Experienced ODs: Understand Essential Business Concepts
Getting There: Planning a Successful Optometric Career
Practice By the Numbers: Track Your Key Expenses

GERALD A. EISENSTATT, OD, MBA,

GERALD A. EISENSTATT, is director, Hayes Center for Practice Excellence, at the Southern College of Optometry. Dr. Eisenstattalso is the owner of his own independent practice, Memphis Family Vision in Memphis, Tenn. To contact him: geisenst@sco.edu


Share:
Rate:

0 / 5. 0